
Visualizing data // infographic comps
A self-initiated project to create some infographics that incorporate 3D elements using Adobe Project Felix. These ‘comps’ visualize the data and content from Coroflot’s 2016 Design Salary.
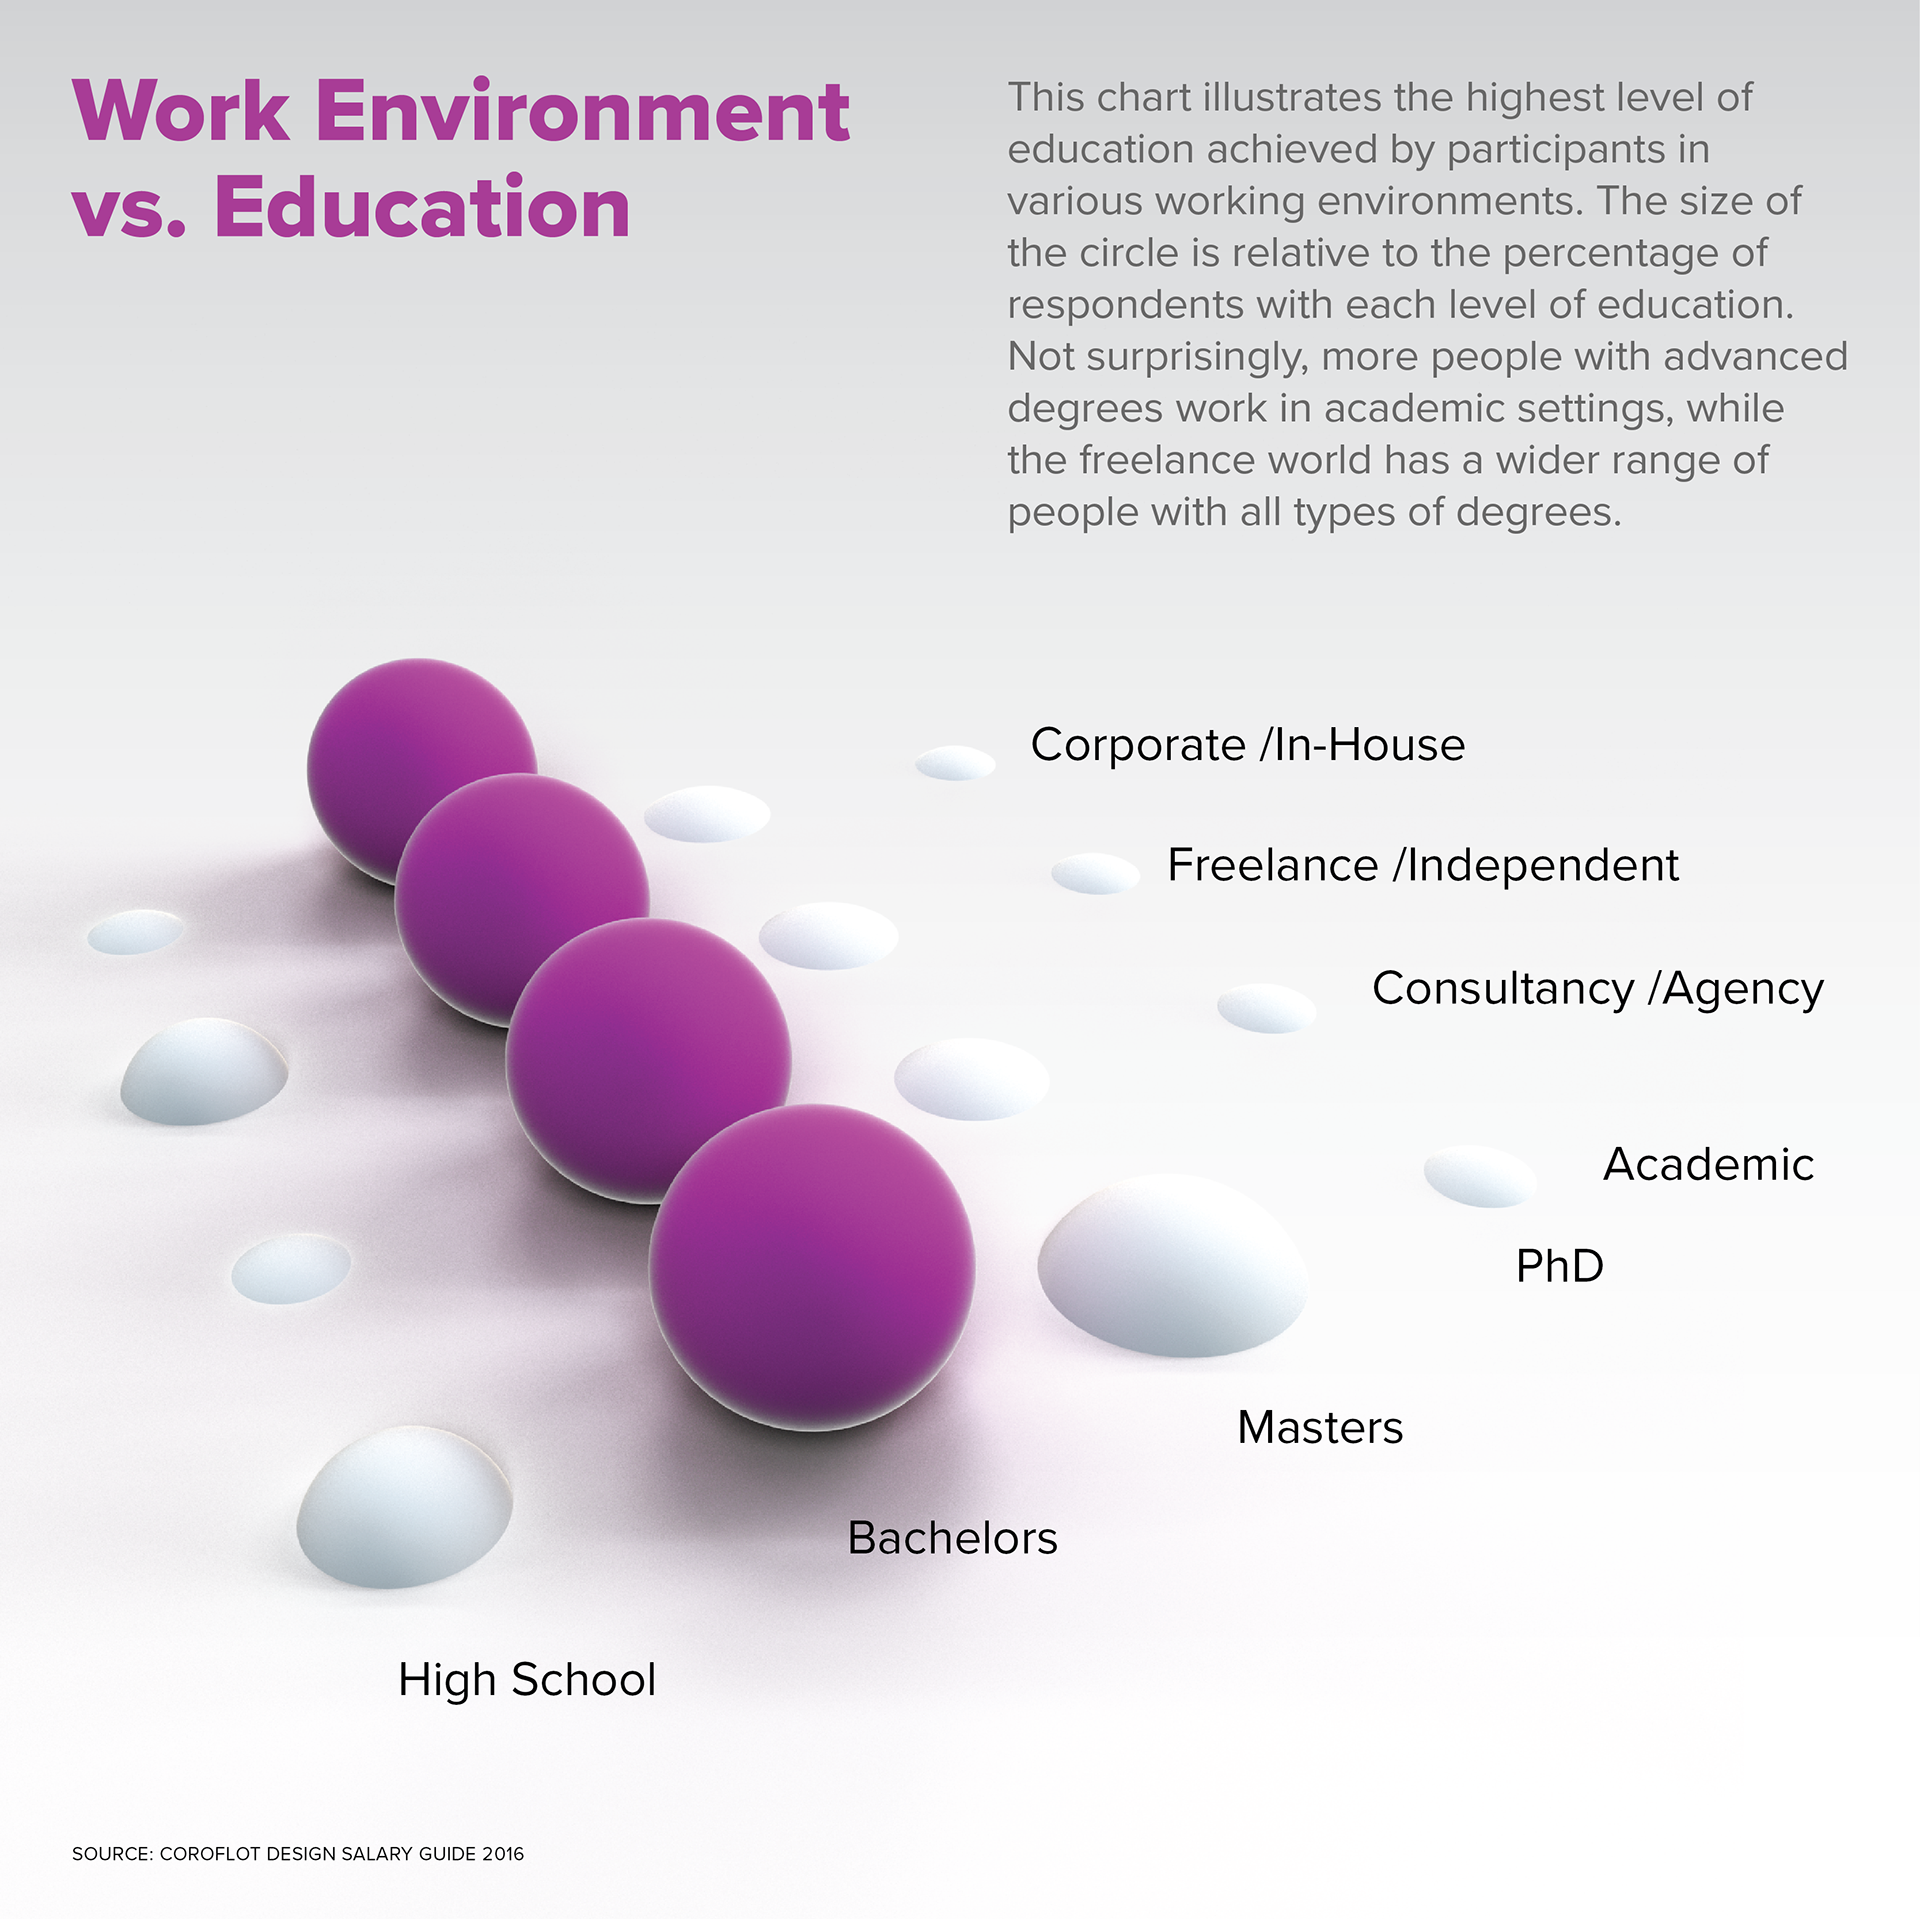


All imagery generated through a combination of Adobe Dimension and Adobe Illustrator.